
 Asset Managers
Optimize your portfolio's performance.
Asset Managers
Optimize your portfolio's performance. 
 Hotel Owners
Create a high-performing independent hotel.
Hotel Owners
Create a high-performing independent hotel. 
 Management Companies
Operate your client’s properties at peak performance.
Management Companies
Operate your client’s properties at peak performance. 
 Real Estate & Hotel Development Companies
Determine revenue potential in each room.
Real Estate & Hotel Development Companies
Determine revenue potential in each room. 
 Vacation Rental Management Companies
Optimize complex inventory structures.
Vacation Rental Management Companies
Optimize complex inventory structures. Putting yourself in someone else’s shoes is a lesson we’ve all been taught at some point in our lives. Now, successful revenue strategy professionals are taking that sage advice to a whole new level.
Some years ago, my sister Wendy was completing her master’s degree. As part of her studies, she was trained to administer and interpret the Myers-Briggs personality test. To practice she had several family members and friends take the test. I was one, along with a life-long friend of mine, Phil. As it turned out, Phil and I were polar opposites, which wasn’t a surprise to our friends and family. I was identified as an ESTJ and Phil as an INPF. At the risk of over-simplifying things, an extrovert (me) and an introvert (Phil).
Shortly after the test, Phil and I embarked on a road trip to help an elderly aunt visit some family. We were on the road for what seemed to me like a short time, and we stopped for gas. Not long after (as it seemed to me), we stopped for a bathroom break. Some ways down the road Phil suggested we stop for lunch. I, practically beside myself with frustration, said: “If we keep stopping every few miles, we’ll NEVER get there!” At which point Phil said: “We haven’t stopped.” I said: “What do you mean we haven’t stopped?? That’s pretty much all we’ve done!” He said: “Those weren’t stops. A stop is when you get out, you take some time, you have some lunch, you stretch your legs, you catch your breath. That’s a stop.” Clearly, Phil’s definition of a stop and mine were…wait for it…polar opposites, night and day.
So, what does this have to do with revenue management during a pandemic? What is it about perceptions that can be so different from one individual to another? To answer these questions, we must first ask and answer another: “What has changed for revenue management professionals during this pandemic”?
First of all, many revenue managers and directors of revenue strategy lost their jobs in the past year. Others have had their roles shift and change, with many instances of having to do more with less. This means having to “state a case” more emphatically, with more clarity than ever, with less time and help to do so.
In order to do that effectively, one must take on a strong leadership role, keep the focus on strategic thinking, and utilize tools that “tell the story” in a quick, compelling, and crystal-clear manner. The first step is knowing your audience. The old saying about putting your feet in someone else’s shoes comes to mind. I’ve sat through enough weekly revenue meetings to know that the “language” of revenue managers is seldom that of directors of sales, or general managers, or front office managers. Often, the perceptions of the people sitting around the table are as different…wait for it…as night and day.
Data Visualization In Revenue Management
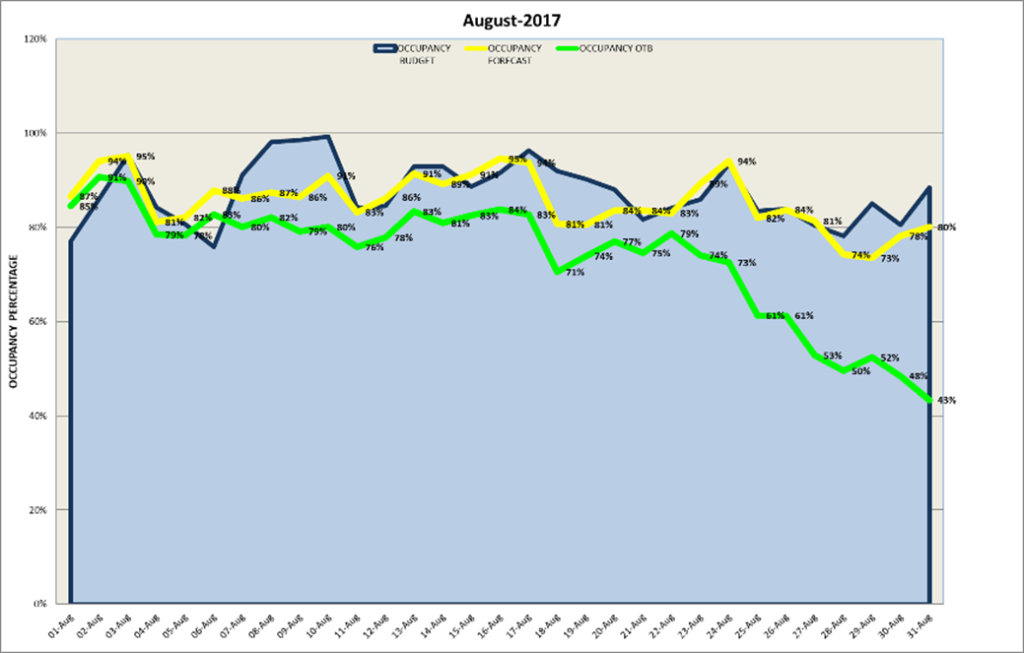
So, the revenue strategist must take two key elements of communication into consideration. The first is the “delivery vehicle”. In what way will you tell your story? Mastering the art of data visualization is the key. Pictures are typically more powerful than words or numbers. I recall a revenue director at one meeting who showed only one graph to the team. Below is an illustration of that graph. The blue line represented the budget. The yellow line the forecast. And the green line the current “on the books”. He then made just one statement. He said: “Apparently the consumer is not cooperating with our budget”.
After the laughter died down, the team got to work. One graph, one statement.
Lateral thinking and the Revenue Team.
The second key element of communication is to better understand the perspective of each member of the team. This reminds me of Edward de Bono’s the Six Thinking Hats. If you Google him, you’ll find he originated the term lateral thinking. He assigned each of the thinking hats a color, and with that designation identified six perspectives. The idea was to harness, then leverage, brainpower in such a manner as to make problem solving more successful. Here are the six hats. What color is your hat?
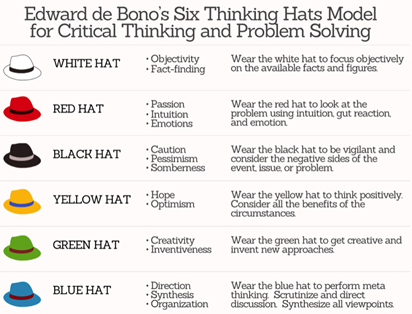
When I first came upon de Bono’s critical thinking model, I marvelled at the simple explanation he gave to describe the thinking process. He used the example of a team of people looking at a house. One was at the front of the house, one at the back, and one on each side. All looking at the exact same house, but from different viewpoints, i.e., different perspectives. In a “thinking hat” exercise, everyone on the team would be asked to wear the same hat at the same time, thus aligning thought processes in order to solve problems. If the director of finance is wearing the black hat, while the director of sales/marketing is wearing the green hat, and the revenue manager the white hat, it’s difficult to find common ground to solve problems. But, using the house analogy, if the team members all come to the front of the house, then all go together to the back of the house, etc., there’s far more likelihood of finding strategic synergies.
Revenue strategists have long complained about being over-ruled or not being listened to at all. In pandemic conditions, so much has changed that no single answer to a problem is sufficient. But focusing on more innovative ways to solve problems is certainly a step in the right direction. Strong, decisive leadership, coupled with higher-level strategic thinking, and better visualization tools will go a long way to setting up a revenue team for success, even in a pandemic.


